BC Tourism and Hospitality Employment Tracker
It’s not magic. It’s mechanics! Statistics Canada conducts monthly data from Statistics Canada’s Labour Force Survey and Qatalyst Research Group generates tables with tourism and hospitality-specific data. Those tables are the most accurate and relevant data source from which we can pull trends in our industry and monitor our post-pandemic recovery on a monthly basis.
Choose your own (statistics) adventure with our online employment tracker. Use the charts automatically generated each month to track employment trends in tourism and hospitality. Or flip the script and plot your own outcomes to create custom charts that dive into data by year, region, sector, or other metrics.
Introduction
The Employment Tracker reports on monthly changes in employment in the BC Tourism and Hospitality industry. The Tracker draws primarily from the Labour Force Survey (LFS), a monthly household survey conducted by Statistics Canada. The LFS is the most timely source of data on the labour market across Canada.
go2HR receives LFS tables generated by Qatalyst Research Group via Statistics Canada's Real Time Remote Access (RTRA) Program that follows the Tourism Satellite Account’s definition of tourism. This data enables go2HR to track changes in employment and major trends in the Tourism and Hospitality industry in BC and monitor the ongoing impact of COVID-19 on the Tourism and Hospitality industry.
Contents
- Chart 1: Employment By Sector, 2019-2026
- Chart 2: Employment By Region, 2019-2026
- Chart 3: Employment By Region and Sector, 2019-2026
- Chart 4: Leading Occupations By Sector, 2019-2026
- Chart 5: Employment By Selected Characteristics, 2026
- Chart 6: Employment By Job Status, 2019-2026
- Chart 7: Labour Force by Sector, 2019-2026
- Chart 8: Labour Force by Region, 2019-2026
- Chart 9: Unemployment Rate, 2019-2026
- Chart 10: Actual Hours Worked Per Week, 2019-2026
- Chart 11: Average Hourly Earnings, 2019-2026
- Chart 12: Sales Revenue of Food Services and Drinking Places, 2019-2025
- Chart 13: Hotel Occupancy Rate, 2019-2025
LFS Limitations
Readers should be aware that the LFS is a sample survey and estimates are subject to both sampling and non-sampling errors.
Statistics Canada develops national labour market projections based on a monthly LFS survey of 56,000 households, covering 100,000 individuals from across Canada. Data is available on a sector (aligned with specific NAICS codes) and regional basis (e.g. by development region within BC). While this sample size provides for statistically reliable projections at the national, provincial and industry levels, the results become less statistically reliable once data is presented at the sector and regional level within BC.
As an illustration, BC accounts for about 12% of Canadian households and the Tourism and Hospitality sector typically employs about 12% of British Columbians. Applying these percentages, we would expect that about 1.4% of the individuals covered in the survey may be associated with the Tourism and Hospitality industry in BC (i.e. Of the 100,000 individuals captured in the household survey, about 1,400 would be associated with the Tourism and Hospitality industry in BC; this would provide a statistically reliable estimate of employment in the industry, equal to ± 2.6% at a confidence level of 95%). As the projections are broken down by sector within the industry and by development region within BC, the results are based on fewer and fewer surveys (and therefore become less statistically reliable). The results are also subject to rounding errors (e.g. results are reported in increments of 2,500).
As such, readers should be cautious when interpreting results presented at the sector and regional levels, particularly for smaller sectors and regions where the results can vary significantly on a month to month basis.
For additional information related to the LFS Study, please refer to the LFS User Guide. For further information about statistical reliability, please refer to Table 7.1 (Coefficients of Variation) in the LFS User Guide. Generally speaking, the larger the count presented in a graph or table, the greater the statistical reliability. When the count (e.g. the number of people employed in the Food and Beverage sector) is greater than or equal to 39,600, the coefficient of variation (CV) is less than or equal to 10%; when the count in the range of 39,600 and 13,900, the CV is from 10% to 20%; and when the counts are below 10,000, the CV is typically 20% or above.
| Count | Coefficient of Variation |
|---|---|
| Over 322,500 | 1% |
| 113,001 to 322,500 | 2.5% |
| 61,201 to 113,000 | 5% |
| 39,601 to 61,200 | 7.5% |
| 18,601 to 39,600 | 10% |
| 13,901 to 18,000 | 16.5% |
| 9,901 to 13,900 | 20% |
| 6,401 to 9,900 | 25% |
| 6,400 or less | 33% |
For more information, please refer to Table 7.1 - Coefficient of variation (CV) for estimates of monthly totals, Canada and provinces, from the LFS User Guide.
Definitions of the Tourism and Hospitality Industry
The North American Industry Classification System (NAICS) is an industry classification system developed by the statistical agencies of Canada, Mexico and the United States. Created against the background of the North American Free Trade Agreement, it is designed to provide common definitions of the industrial structure of the three countries and a common statistical framework to facilitate the analysis of the three economies. NAICS is based on supply-side or production-oriented principles, to ensure that industrial data, classified to NAICS, are suitable for the analysis of production-related issues such as industrial performance[1].
This employment tracker follows the Tourism Satellite Account's definition of Tourism and Hospitality sector, which is defined by the following NAICS codes:
- Accommodation:
- 7211 Traveller accommodation
- 7212 Recreational vehicle (RV) parks and recreational camps
- Food and Beverage Services:
- 7224 Drinking places (alcoholic beverages)
- 7225 Full-service restaurants and limited-service eating places
- Recreation and Entertainment:
- 5121 Motion picture and video exhibition
- 7111 Performing arts companies
- 7112 Spectator sports
- 7115 Independent artists, writers and performers
- 7121 Heritage institutions
- 7131 Amusement parks and arcades
- 7132 Gambling industries
- 7139 Other amusement and recreation industries
- Transportation and Travel Services:
- 4811 Scheduled air transport
- 4812 Non-scheduled air transport
- 4821 Rail transportation
- 4831 Deep sea, coastal and great lakes water transportation
- 4832 Inland water transportation
- 4851 Urban transit systems
- 4853 Taxi and limousine service
- 4854 School and employee bus transportation
- 4855 Charter bus industry
- 4859 Other transit and ground passenger transportation
- 4871 Scenic and sightseeing transportation – land
- 4872 Scenic and sightseeing transportation – water
- 4879 Scenic and sightseeing transportation – other
- 5321 Automotive equipment rental and leasing
- 5615 Travel arrangement and reservation services
Further details can be found here. Detailed definitions of the NAICS code can be found here.
Map of BC Economic Development Regions
LFS collects data from the eight economic development regions within British Columbia: North Coast, Nechako, Northeast, Cariboo, Vancouver Island/Coast, Mainland/Southwest, Thompson Okanagan, and the Kootenays. The following map shows the eight economic development regions in British Columbia.
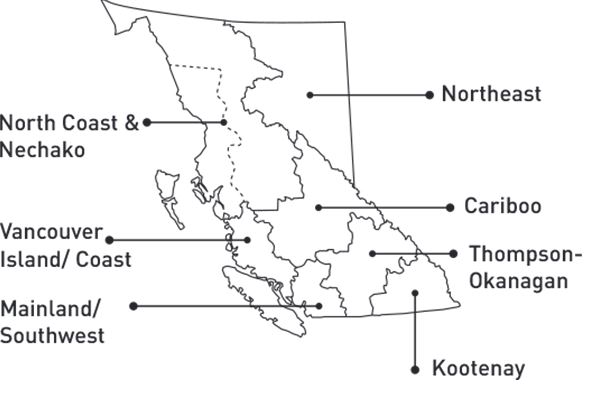
Source: https://pwp.vpl.ca/siic/job-search-resources/regions-of-british-columbia/
While there are eight development regions in BC, this employment tracker reports data for six regions:
- Cariboo
- Lower Mainland
- Northern BC (North Coast, Northeast, Nechako)
- Thompson Okanagan
- Kootenay
- Vancouver Island
Three of the Northern regions (Northeast, North Coast, and Nechako) are sparsely sampled by the LFS, so the data for these regions are combined and defined to be Northern BC.
Comparison of Development Regions to Tourism Regions in BCThe map below compares the eight economic development regions (black uppercase text and transparent) to the six tourism regions (white text and coloured) in BC. The six tourism regions within British Columbia include Northern BC, Cariboo Chilcotin Coast, Vancouver Island, Vancouver Coast & Mountains, Thompson Okanagan, and Kootenay Rockies. The tourism regions align with the six regional destination marketing organizations in British Columbia. As indicated below, while there is some commonality between the two sets of regional definitions, no region aligns directly with their counterpart in the opposite set.
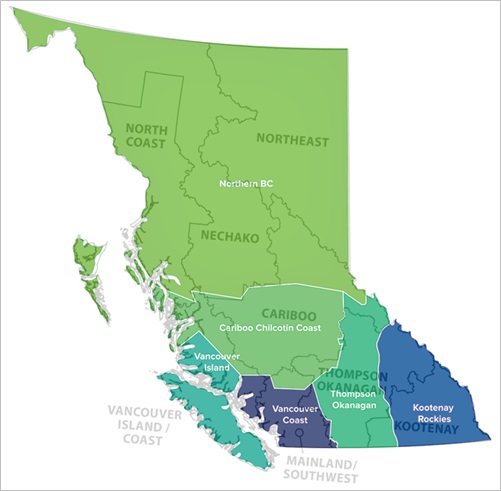
Source: GO2HR. https://www.go2hr.ca/essential-tips-info/working-in-bc-tourism-regions;
WorkBC. https://www.workbc.ca/labour-market-industry/regional-profiles.aspx
Chart 1: Employment By Sector, 2019-2026
Key Takeaways:
- Employment in BC’s Tourism and Hospitality sector decreased by 0.3% from 332,750 in December 2025 to 331,750 in January 2026. Tourism and Hospitality employment in BC is lower than pre-COVID levels, with 19,000 fewer jobs compared to January 2019 (350,750 in January 2019 vs 331,750 in January 2026).
How to Use & Limitations
Chart 1 tracks monthly employment in BC's Tourism and Hospitality sector since 2019. Users can select data for each sector at the right-hand side of the chart. Display options include line chart or bar chart. Users may also compare employment data across sectors for a single selected year. This option is available by clicking the Invert Options button at the bottom right of the chart window.
Clicking the View Table button beneath the graph will expand a table displaying the same information as the graph. There is also a Download button, which will download a csv file containing the data used to create the graph.
Please note: Please note: There is high variability in monthly industry sector data at the provincial level. Coefficient of Variation for BC estimates can be found here.
Sector
Years
Style
Year
Sectors
Style
View Table
Chart 2: Employment By Region, 2019-2026
Key Takeaways:
- Employment in BC’s Tourism and Hospitality sector decreased by 0.3% from 332,750 in December 2025 to 331,750 in January 2026. Employment increased in the Lower Mainland region but decreased in all other economic regions.
- Tourism and Hospitality employment in January 2026 in the Thompson Okanagan and Vancouver Island regions was above pre-COVID levels. Employment in the Cariboo, Lower Mainland, Northern BC, and Kootenay regions was below pre-COVID levels.
How to Use & Limitations
Chart 2 displays Tourism and Hospitality employment information for each of the economic development regions in BC Users can select data for each region at the right-hand side of the chart. Display options include line chart or bar chart. Users may also compare employment data across regions for a single selected year. This option is available by clicking the Invert Options button at the bottom right of the chart window.
Clicking the View Table button beneath the graph will expand a table displaying the same information as the graph. There is also a Download button, which will download a csv file containing all of the data used to create the graph.
Please note: There is high variability in monthly industry sector data at the regional level, typically higher than the variability at the provincial level. Coefficient of Variation for BC estimates can be found here.
Region
Years
Style
Year
Regions
Style
View Table
Chart 3: Employment By Region and Sector, 2019-2026
Key Takeaways:
- Employment decreased in the Accommodation, Food and Beverage, and Transportation and Travel sectors but increased in the Recreation and Entertainment sector from December 2025 to January 2026.
- Among all Tourism and Hospitality sectors, the Accommodation and Recreation and Entertainment sectors have passed pre-COVID levels (January 2019) in terms of employment. While the Food and Beverage and Transportation and Travel sectors are below pre-COVID levels.
How to Use & Limitations
Chart 3 displays the same employment information but for each of the Tourism and Hospitality sectors and economic development regions in BC since 2019. For each region and year, users can select data for multiple sectors at the right-hand side of the chart. Users may also compare employment data across regions for any selected sector and year. This option is available by clicking the Invert Options button at the bottom right of the chart window.
Clicking the View Table button beneath the graph will expand a table displaying the same information as the graph. There is also a Download button, which will download a csv file containing all of the data used to create the graph.
Please note: There is high variability in monthly industry sector data at the regional level, typically higher than the variability at the provincial level. Coefficient of Variation for BC estimates can be found here. Due to the small sample in the region and sector data reported by the LFS, Thompson-Okanagan and Kootenay are combined only for reporting purposes and are combined only on this chart.
Region
Year
Sectors
Style
Sector
Year
Regions
Style
View Table
Chart 4: Leading Occupations By Sector, 2019-2026
Key Takeaways:
- Leading occupations (those that reported a greater employment weight) in the Tourism and Hospitality industry in BC include Creative and performing artists; Photographers, graphic arts technicians and technical and co-ordinating occupations in motion pictures, broadcasting and the performing arts; Athletes, coaches, referees and related occupations; Service Supervisors; Chefs and cooks; Occupations in food and beverage service; Occupations in travel and accommodation; Cashiers; Food counter attendants, kitchen helpers and related support occupations; Cleaners; Machinery and transportation equipment mechanics; and Motor vehicle and transit drivers.
- More than half of the leading occupations are still experiencing lower employment levels compared to their pre-COVID employment levels in 2019. However, employment in some leading occupations, such as Athletes, coaches, referees and related occupations, Chefs and Cooks, Support occupations in accommodation, and Transportation officers and controllers, remains higher than their 2019 levels. Care must be used in interpreting the data, given that the Coefficient of Variation for each of the reported occupations is from 20% to well over 35%.
- Although employment levels among all four Tourism and Hospitality sectors have been impacted by COVID-19, leading occupations in Food and Beverage Services have recovered 78% of the pre-COVID-19 level, while occupations in Travel and Accommodation Services have recovered 89% of the pre-COVID levels.
- Various occupations exist in multiple sectors. For example, chefs and cooks exist in both Accommodation and Food and Beverage sectors, while the Food and Beverage sector accounted for a higher percentage of the overall chefs and cooks employed in the industry.
How to Use & Limitations
Chart 4 shows employment levels broken down by leading occupations (in 3-digits NOCs) for each Tourism and Hospitality sector in BC Users can select data for each sector at the right-hand side of the chart. Users may also compare employment data across multiple sectors for any selected occupation. This chart also provides an option to show year over year changes in employment levels of a sector's leading occupations. This provides a comparison of pre and post pandemic employment levels in selected occupations and sectors. This option is available by selecting Across Years under Display.
Clicking the View Table button beneath the graph will expand a table displaying the same information as the graph. There is also a Download button, which will download a csv file containing all of the data used to create the graph.
Detailed information of the Canadian NOC codes can be found here.Please note: Some occupations may result in a large sampling error, to accompany this issue to some degree, the chart also provides an option to display 3-months moving averages. However, users should still note the high variability in monthly occupational data at the provincial level. Coefficient of Variation for BC estimates can be found here.
Display
Sector
Data Source
Display
Sector
Data Source
Display
Occupations
Data Source
View Table
Chart 5: Employment By Selected Characteristics
Key Takeaways:
- Of those employed in BC’s Tourism and Hospitality industry, 52% are male and 48% are female. The Transportation and Travel Services sector has the highest concentration of males at 71%, while the Food and Beverage sector has the highest concentration of females at 56%. About 71% of workers are between 15 to 44 years of age. About 29% of workers in BC’s Tourism and Hospitality industry have a degree or diploma below a bachelor’s, and 29% have a bachelor’s degree or higher.
How to Use & Limitations
Chart 5 presents a series of employment distributions in BC's Tourism and Hospitality Sector by selected characteristics such as gender, age group, and education levels. Data is presented for the latest available month. User may switch between charts by selecting an option under Characteristics at the top right of the chart window.
Clicking the View Table button beneath the graph will expand a table displaying the same information as the graph. There is also a Download button, which will download a csv file containing all of the data used to create the graph.
Please note: There is high variability in monthly industry sector data at the provincial level. Coefficient of Variation for BC estimates can be found here.
Characteristic
Display
Characteristic
Sectors
Characteristic
View Table
Chart 6: Employment By Job Status, 2019-2026
Key Takeaways:
- Overall, employment in BC’s Tourism and Hospitality sector decreased by 0.3% from 332,750 in December 2025 to 331,750 in January 2026, and the percentage of workers employed full-time also decreased (64% in December 2025 vs 62% in January 2026).
- In January 2026, the Transportation and Travel sector led the BC tourism industry with approximately 89% full-time workers, as compared to a low of 49% full-time workers in the Food and Beverage sector.
How to Use & Limitations
Chart 6 tracks monthly full time and part time employment in BC's Tourism and Hospitality sector since 2019. This chart has three display options, which can be toggled at the lower right-hand side of the chart. The first option displays the total employment as well as the percentage of full time and part time workers; while this option is selected, a single a single year and sector can be displayed at a time. The second option shows all sectors at once, and allows the user to select as single year and status at a time. The third option shows all years at once, and allows the user to select a single status and sector at a time.
Clicking the View Table button beneath the graph will expand a table displaying the same information as the graph. There is also a Download button, which will download a csv file containing all of the data used to create the graph.
Please note: There is high variability in monthly industry sector data at the provincial level. Coefficient of Variation for BC estimates can be found here.
Year
Sector
Options
Year
Status
Options
Status
Sector
Options
View Table
Chart 7: Labour Force by Sector, 2019-2026
Key Takeaways:
- The Tourism and Hospitality labour force includes all the people working in the Tourism and Hospitality sector as well as unemployed individuals seeking work whose last job was in the Tourism and Hospitality sector. The total number of people in the Tourism and Hospitality labor force shows how many individuals are available to work in the sector. Reductions in the labor force can be due to workers moving to different industries for work, declines in available employment opportunities, or because unemployed workers decide not to continue looking for work in the sector.
- The Tourism and Hospitality labour force increased 0.6% to 354,750 in January 2026 from 352,500 in December 2025. Labour force gains were observed in the Recreation and Entertainment and Transportation and Travel sectors which outweighed losses in the Accommodation and Food and Beverage services sectors.
- Data suggests that the overall industry labour force has not surpassed its pre-COVID level (367,000 in January 2019 vs 354,750 in January 2026).
How to Use & Limitations
Chart 7 tracks the labour force in each of the Tourism and Hospitality sectors in BC This chart has three display options, which can be toggled in the lower right-hand corner of the chart. The first option displays the total monthly labour force for a selected sector for the last three years since 2019. The second option shows the total monthly labour force broken down into employed and unemployed workers for a selected year and sector. The third option displays the total monthly labour force for any number of sectors in a given year.
Clicking the View Table button beneath the graph will expand a table displaying the same information as the graph. There is also a Download button, which will download a csv file containing all of the data used to create the graph.
Please note: There is high variability in monthly industry sector data at the provincial level. Coefficient of Variation for BC estimates can be found here.
Sector
Options
Year
Sector
Options
Year
Sector
Options
View Table
Chart 8: Labour Force by Region, 2019-2026
Key Takeaways:
- The Tourism and Hospitality labor force includes people working in the Tourism and Hospitality sector as well as unemployed individuals seeking work whose last job was in the Tourism and Hospitality sector. The total number of people in the Tourism and Hospitality labour force shows how many individuals are available to work in the sector. Reductions in the labor force can be due to workers moving to different industries for work, declines in available employment opportunities, or because unemployed workers decide not to continue looking for work in the sector.
- The Tourism and Hospitality labour force increased 0.6% to 354,750 in January 2026 from 352,500 in December 2025. Labour force gains were observed in the Lower Mainland region. Labour force losses were observed in the Cariboo, Kootenay, Thompson Okanagan, Northern BC and Vancouver Island regions.
- Data suggests that the overall industry labour force has not surpassed its pre-COVID level (367,000 in January 2019 vs 354,750 in January 2026).
How to Use & Limitations
Chart 8 tracks the labour force in each of the economic development regions in BC This chart has three display options, which can be toggled in the lower right-hand corner of the chart. The first option displays the total monthly labour force for a selected region for the last three years since 2019. The second option shows the total monthly labour force broken down into employed and unemployed workers for a selected year and region. The third option displays the total monthly labour force for any number of regions in a given year.
Clicking the View Table button beneath the graph will expand a table displaying the same information as the graph. There is also a Download button, which will download a csv file containing all of the data used to create the graph.
Please note: There is high variability in monthly industry sector data at the regional level, typically higher than the variability at the provincial level. Coefficient of Variation for BC estimates can be found here. Regional data on unemployment with counts below 10,000 must be used with high caution.
Region
Options
Year
Region
Options
Year
Regions
Options
View Table
Chart 9: Unemployment Rate, 2019-2026
Key Takeaways:
- The unemployment rate in the Tourism and Hospitality sector in BC increased from 5.6% in December 2025 to 6.5% in January 2026. The unemployment rate is above the pre-COVID level (4.4% in January 2019 vs 6.5% in January 2026). The quoted unemployment rate is lower in comparison to the same month in 2020 and 2021.
- In January 2026, the unemployment rate ranged from 2.8% to 8.6% across the four Tourism and Hospitality sectors. The Food and Beverage service sector has a relatively higher unemployment rate.
- The unemployment rate in January 2026 ranged from 4.7 to 11.1% across the six economic development regions in BC. The Lower Mainland region had the lowest unemployment rate, while the Cariboo region had the highest.
How to Use & Limitations
Chart 9 tracks the unemployment rate of the Tourism and Hospitality sector in BC This chart has four display options, which can be toggled in the lower right-hand corner of the chart. The first two options allow users to group data by sector and the last two options allow users to group data by region. The first and third option, labeled "filter by", will display the monthly unemployment rate for a selected sector or region over the past three years since 2019. The second and fourth options, labeled "show all", will display the unemployment rate for any number of sectors or regions for one selected year.
Clicking the View Table button beneath the graph will expand a table displaying the same information as the graph. There is also a Download button, which will download a csv file containing all of the data used to create the graph.
Readers should note that Canadians are considered unemployed if they are actively seeking work. The number of individuals employed in BC's Tourism and Hospitality sector has decreased by 70,000 from February 2020 to date, but the number of "unemployed" individuals increased by only 4,000, which shows that unemployed individuals have decided that actively seeking work is either not beneficial, or they are waiting for businesses to re-open before continuing to look for work. The abruptness of the job losses resulting from the COVID-19 pandemic and the attached restrictions has created a unique labor market and therefore the unemployment rate can only tell part of the story. When restrictions are lifted, businesses are able to re-open, and emergency benefits are drawn back, the unemployment rate will become a more accurate indicator of the relative strength of the labour market.
Please note: There is high variability in monthly demographic data at the provincial level and regional level. Coefficient of Variation for BC estimates can be found here.
Sector
Options
Year
Sector
Options
Region
Options
Year
Region
Options
View Table
Chart 10: Actual Hours Worked Per Week, 2019-2026
Key Takeaways:
- Aggregate weekly hours worked in BC’s Tourism and Hospitality sector increased from 8.96 million hours worked per week in November 2025 to 9.66 million hours worked per week in December 2025. The increase was driven by substantial growth in hours worked per week in the Transportation sector, which saw an increase of 403,500 hours worked per week. In terms of regions, the Lower Mainland had the largest increase of 487,000 hours worked per week.
- The overall actual hours worked per week were lower than pre-COVID levels (9.29 million hours worked per week in January 2026 vs 10.2 million hours worked per week in January 2019).
How to Use & Limitations
Aggregate weekly hours worked in BC's Tourism and Hospitality sector increased from 9.90 million hours worked in June 2024 to 10.14 million hours worked in July 2024. Growth was driven by the Accommodation sector which saw a substantial increase of 263,000 hours (10,230,000 in July 2024 vs 760,000 in June 2024). In terms of regions, the Vancouver Island region had the largest increase, while the Thompson Okanagan region had the largest decrease.
The overall actual hours worked per week were lower in comparison to the pre-COVID levels (10.14 million hours worked per week in July 2024 vs 10.61 million hours worked per week in July 2019).
Please note: There is high variability in monthly demographic data at the provincial level and regional level. Coefficient of Variation for BC estimates can be found here.
Sector
Options
Year
Sector
Options
Region
Options
Year
Region
Options
View Table
Chart 11: Average Hourly Earnings, 2019-2026
Key Takeaways:
- Average hourly earnings in BC’s Tourism and Hospitality sector have been steady with some fluctuation over the past two years. Average hourly earnings by sector ranged from $22 to $43 in January 2026; the Transportation sector had the highest average hourly earnings, while the Food and Beverage sector reported the lowest.
- Average hourly earnings by region ranged from $23 to $30 in January 2026; the Lower Mainland and Cariboo regions reported the highest average, while the Kootenay region had the lowest average.
How to Use & Limitations
Chart 11 tracks the average hourly wage in the Tourism and Hospitality sector in B.C each month. This chart has four display options, which can be toggled in the lower right-hand corner of the chart. The first two options allow users to group data by sector and the last two options allow users to group data by region. The first and third option, labeled "filter by", will display the hourly wage for one selected sector or region over the past three years since 2019. The second and fourth options, labeled "show all", will display the hourly wage for any number of sectors or regions for one selected year.
Clicking the View Table button beneath the graph will expand a table displaying the same information as the graph. There is also a Download button, which will download a csv file containing all of the data used to create the graph.
Please note: There is high variability in monthly demographic data at the provincial level and regional level. Coefficient of Variation for BC estimates can be found here.
Sector
Options
Year
Sector
Options
Region
Options
Year
Region
Options
View Table
Chart 12: Sales Revenue of Food Services and Drinking Places, 2019-2025
Key Takeaways:
- Employment in the Food and Beverage sector increased 3.9% from October 2025 to November 2025, but sales of food services and drinking places decreased 4.4% over this time.
- Sales revenues of food services and drinking places are higher than pre-COVID levels ($1.39 million in November 2025 vs $1.07 million in November 2019) Sales revenue in November 2025 is also higher than in the same month in 2020 ($796,098), 2021 ($1,034,294), 2022 ($1,161,519), 2023 ($1,253,595), and 2024 ($1,343,977).
How to Use & Limitations
Chart 12 displays the monthly sales of food services and drink places in thousands of dollars each month for the last three years since 2019.
Clicking the View Table button beneath the graph will expand a table displaying the same information as the graph. There is also a Download button, which will download a csv file containing the data used to create the graph.
Source: Statistics Canada. Table 21-10-0019-01 Monthly survey of food services and drinking places (x 1,000)
View Table
Chart 13: Hotel Occupancy Rate, 2019-2025
Key Takeaways:
- Employment in the Accommodation sector increased 15.6% from November 2025 to December 2025, but Hotel Occupancy rates in BC decreased by 5.1 percentage points from 60.7 percentage points in November 2025 to 55.6 percentage points in December 2025.
- Provincial hotel occupancy rates are slightly higher than pre-COVID levels (55.2 in December 2019 vs 55.6 in December 2025).
How to Use & Limitations
Chart 13 displays the hotel occupancy rate each month for the last three years since 2019.
Clicking the View Table button beneath the graph will expand a table displaying the same information as the graph. There is also a Download button, which will download a csv file containing all of the data used to create the graph.
Source: Tourism Industry Dashboard, Destination BC. URL: https://www.destinationbc.ca/tourism-industry-dashboard/
Show Employment
View Table
1. ^https://www.statcan.gc.ca/eng/subjects/standard/naics/2017/v3/introduction
The views and opinions expressed in this report are those of its author(s) and not the official policy or position of the Government of British Columbia.